The slaughterhouse in equity markets and riots in London are THE headlines of the week, because I know very little about riots (apart from the Los Angeles ones and some historical backing of Watts & Chicago) I’ll focus on the markets.
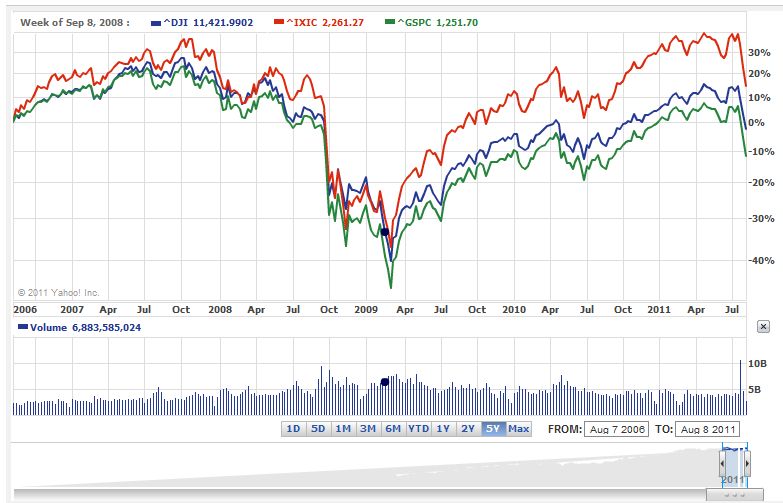
There are a few charts I want to use to back up the story, first of all is a chart showing the growth of the major US indices: Dow Jones Industrial Average, the S&P 500, and the NASDAQ (DJIA, GSPC, IXIC), when you look at them in terms of growth then you see there is an obviously close correlation in terms of the ups and downs of the market with the NASDAQ having come out of 2009 ahead of the others.
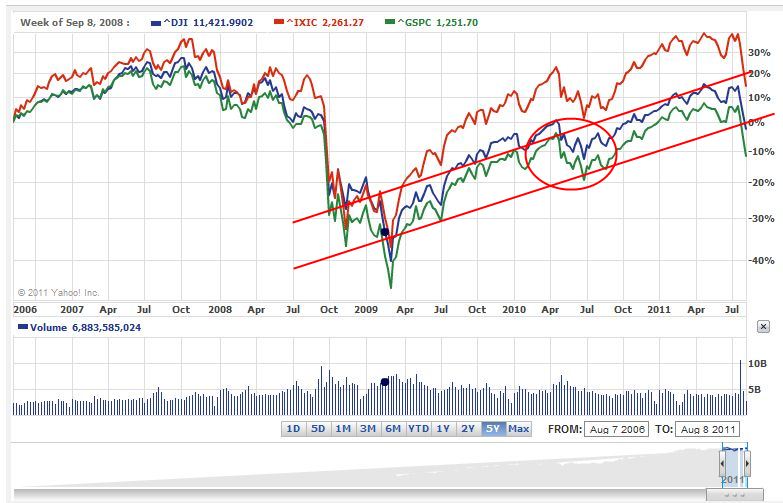
Which brings us to our next chart, looking at a trading range for the Dow and S&P (Which I have taken because they are more in tandem with each other.The two red lines represent broad momentum and trading ranges, where the red circle occurs is a pull-back from the time when they started to trade above range (of course there were economic and banking matters occurring too). Then it is back to being in a broad trading range again which makes the drop off on the right hand side somewhat worrying.
If stock markets return on average 8% a year then the fact that most of the indices effectively doubled since 2009 does not bode well for stocks. The 2009 low was probably an exaggerated bottom and for that reason it may not be as bad as it looks, but in a slow growth economy where earnings become harder to find it is difficult to make a case for growth. Bernanke’s plan is likely to put a floor on stock prices but it hasn’t worked to date, it did provide an adrenaline injection but that isn’t lasting. You get what you pay for, except for when it comes to stimulus!
The one thing that may change all of this will be strong earnings reports and if the likes of the S&P start to trade below 14 times earnings at which point everybody knows to jump back in, but with a current estimate of $74.99 that gives a valuation of 1,050 meaning we will see a stock market crash to get there: that is taking the 1,363 high (and more recent 1,353 from July) and knocking 20% off of it – which would bring us to 1,082 (and that is still a little over 14 times earnings [currently close to 18 times]).
Thus our call is that only upside earnings will reverse the move to 1,050 because under current fundamentals that is broadly the range we see it going to, thus in the near term shorting the S&P via a Short S&P ETF.


Post a Comment